When I first started as a user researcher, my work usually went like this:
- Get some users
- Observe their behavior
- Ask them a few questions
- Report my learnings to my team
Easy, right? And back then, it was also easy to judge my research’s success. Did the team revise the product? If so: yay! 😀 And if not: boo! 😢
But reporting what users do only scratches the surface of what user research can do. Over time, I’ve started asking how I can better make lasting sense of users’ behaviors and values. I work to provide insights that go beyond the immediate question and guide the team’s approach to future designs.
For most studies, this means I present results as a story through theories and visual frameworks. Sometimes I create new ones as I need them. And I judge my research’s success by how much teams use these theories and frameworks in their day-to-day work.
Making meaning with theory
Influencing product teams using theory can be unfamiliar, especially for newer user researchers. So here’s an example of a time my product team needed to make sense of a mix of strong, contradictory reactions from users.
Last summer, I was doing early research on a design concept that people would see when applying for jobs. If they began to apply for a position and didn’t meet the requirements, we’d encourage them to take steps to improve their chances. For example, we might suggest that they consider other related roles that more closely matched the experience on their resume.
Half of our research participants loved the concept and urged us to build it for them. The other half strongly disliked it.
As a user researcher, it would have been easy to just say “some users liked it, some didn’t.” Then, I could have thrown some quotes and videos on a few slides explaining each perspective and called it a presentation. That would tell my team what the users felt. But it wouldn’t tell them why, which is what they needed to know to make meaningful changes to the product.
To help my team understand those mixed emotions, I had to show where they came from. And that’s theory’s superpower — it helps you explain why the users feel the way they do.
Picking a theory to use
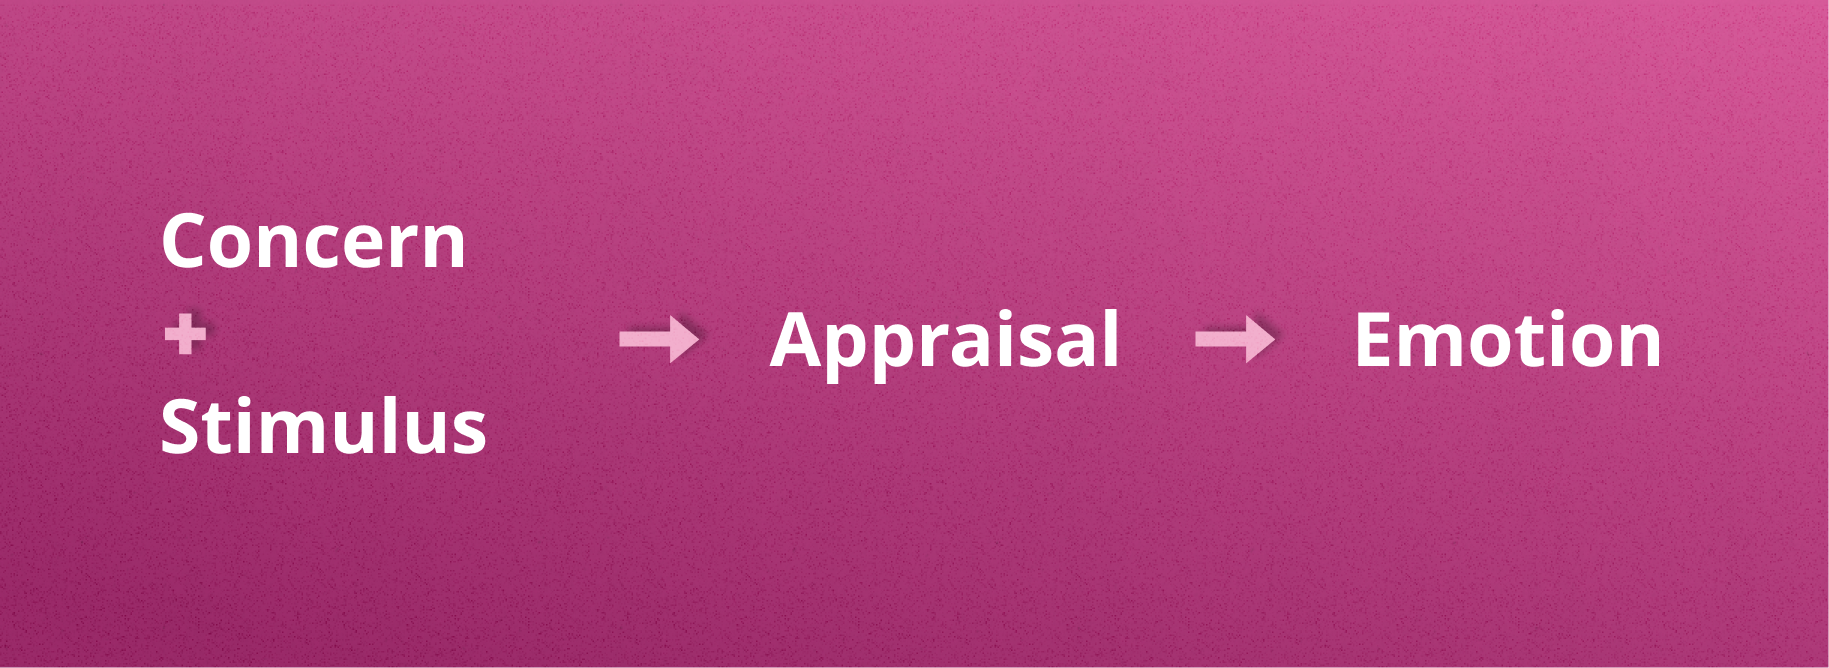
In this case, I chose to use appraisal theory. In this widely adopted framework, emotions come from a person’s judgment of an event or situation. That judgment is the appraisal that gives the theory its name.
In 2007, Delft University of Technology professors Pieter Desmet and Paul Hekkert published a journal article that popularized it as a model for understanding reactions to product design. Here’s how it works:
- A person holds a pre-existing concern such as a motivation, need, goal, or value.
Example: “I never buy anything full price.” - The person encounters a product or experience that causes an emotional reaction.
Example: A store offers coupons through a social media account. - The pre-existing concern shapes the person’s appraisal of the product experience.
Example: “This is a great way to get deals.” - That appraisal inspires an emotion in the person.
Example: Satisfaction.
It’s easy to imagine how a different concern could lead to a different emotional reaction. Someone who finds ads intrusive and distracting might appraise the coupon account as spammy and react with disgust.
Sorting the data
My first step was to organize my usability study participants into two groups based on their emotional reactions. One group for those who loved the concept, and a second group for those who disliked it.
Next, I reflected on the different feelings and attitudes that our participants expressed. Doing this let me find a single dimension that distinguished those who liked the feature from those who didn’t. Here’s what I found:
- The people who loved the concept tended to see job description requirements as more fixed and strict
- The people who disliked the concept tended to see job description requirements as more fluid and subjective
When I looked at the “fixed” group, they tended to value guidance that could help them tailor their job applications around employers’ requirements. They felt this increased their chances of success.
In contrast, the “fluid” group tended to dislike the idea of being encouraged to tailor or reconsider a job application, no matter the odds. This group often saw the employer as the party that’s principally responsible for identifying their value from their application materials.
Presenting the results
Using this framework helped the team connect each group’s values and beliefs to its strong emotional reaction to the product concept.
To illustrate my results for the team, I created two diagrams, one for each of the two segments. Here’s one for the group that loved the concept.
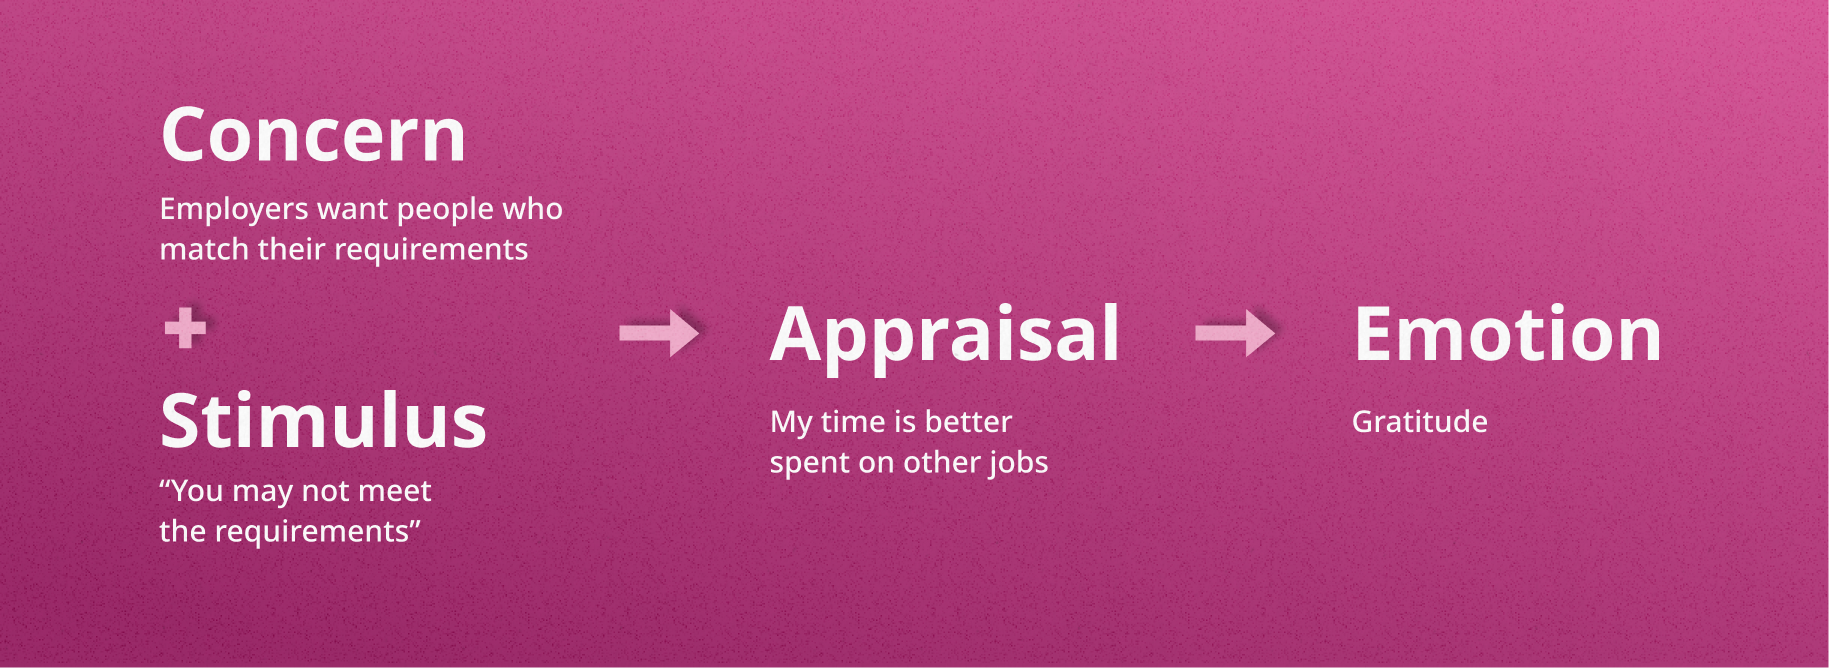
Constructing these emotional appraisal diagrams accomplished two things.
First, they brought structure and clarity to the team’s understanding of the responses to the product. Using the diagrams, we went beyond discussing emotionally heated video clips and quotes. Instead, we focused on each group’s values and the ways the functionality of our concept collided with them, resulting in those emotions.
Second, it helped me be a better researcher. Using this process, I made sure I fully understood a complex-seeming mix of emotions and could explain participants’ reactions. It held me to a higher analysis bar.
After digesting the research, the team brainstormed ideas for revising the design to avert those bad feelings. Today the feature is live and helping applicants improve their chances of getting a job.
Adding theories to your toolkit
I’ll be glad if more researchers start using appraisal theory. But there are many others we can use to bring meaning to our results and support our product teams. Do you have a favorite theory or framework that’s helped you, and how did you use it?